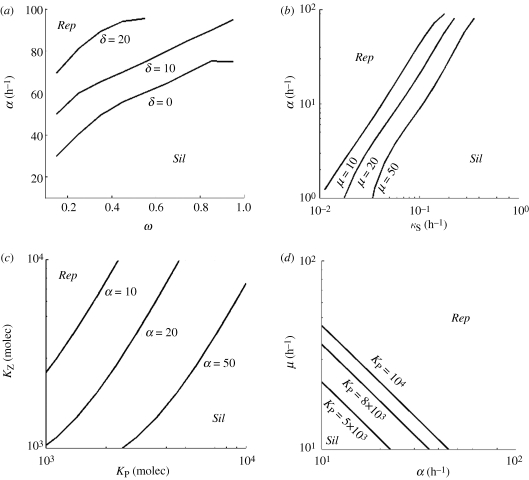
Figure 3.
Phase diagrams identify different viral strategies. (a) The effect of the catalytic constant of DICER cleavage (δ) in the replication rate (α) and the differential affinity of RdRps for positive and negative strands (ω). (b) The relationship between α and the ssRNA degradation rate (κS) for different values of the translation rate (μ). (c) The sensitivity of the binding constants of ribosomes (KZ) and replicases (KP) to α. (d) The effect of KP on μ and α. Rep means viral replication bypassing silencing, and Sil viral extinction by silencing.

