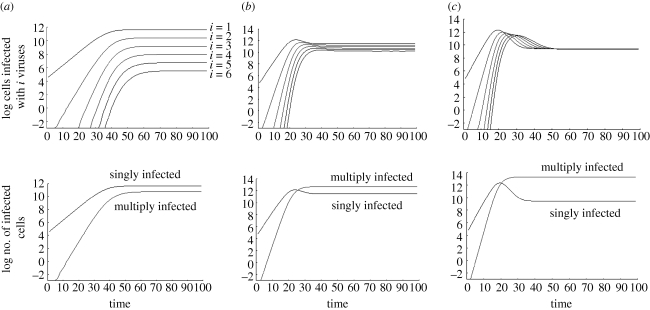
Figure 3.
Equilibrium properties. The time course for cells infected with 1, 2, 3, … , 6 viruses is plotted, depending on the overall rate of viral spread (determined by the balance of the viral replication rate and the death rate of infected cells). (a) For slow viral spread rates, the difference in the abundance of the individual infected cell subpopulations is relatively large, and the singly infected cell population is more abundant than the sum of all multiply infected cells. (b) Increasing the viral spread rate brings the abundance of the individual infected cell subpopulations closer, and now the overall number of multiply infected cells is higher than the number of singly infected cells. (c) For faster viral spread rates, the abundances of the individual infected cell subpopulations become even closer to each other. In the limit for infinitely fast viral spread, the infected cell subpopulations will converge to becoming identical. As in the previous parameter region, the overall number of multiply infected cells is higher than the number of singly infected cells. Standard deviations were not plotted in order to make the graphs easier to read. Parameters were chosen as follows: grid size, 800 × 800; L = 0.5; d = 0.001; B = 0.5. For (a) a = 0.3, (b) a = 0.1, (c) a = 0.01.

