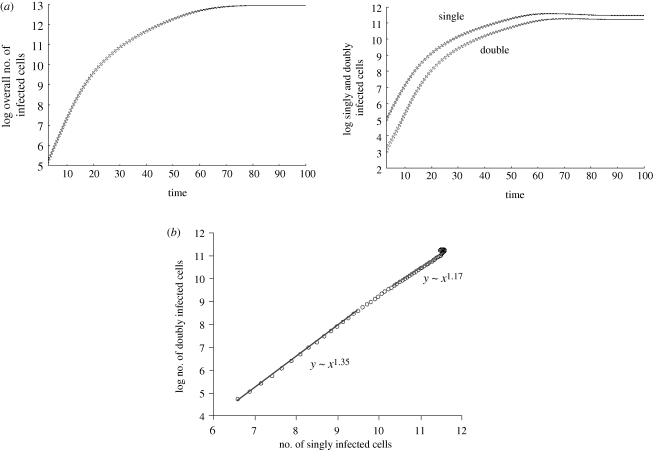
Figure 5.
Computer simulation results assuming an intermediate degree of spatial restriction with regard to infection. Average population sizes are plotted, and the dotted line represents the standard deviations. (a) The basic growth pattern is intermediate between the one found for perfect mixing and extreme spatial restriction. At the beginning, growth is exponential. Subsequently, growth slows down such that the square root of the number of infected cells grows linearly in time. Finally, the average populations converge to equilibrium. The higher the degree of mixing, the more pronounced the exponential growth phase. (b) The correlation between the number of doubly infected cells and the number of singly infected cells lies between linear and square, depending on the exact degree of mixing. As growth slows down, the correlation tends further towards linear. Linear regression during the beginning and the end of the exponential growth phase was used to obtain the correlations. Parameters were chosen as follows: grid size, 800 × 800; L = 0.5; d = 0.001; B = 0.5; a = 0.1.

