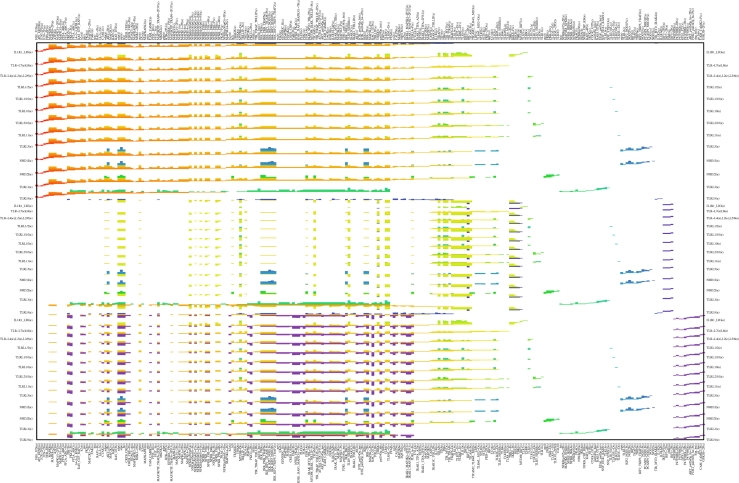
Figure 6.
Sequential information processing by the TLR network: the I–O path matrix. Each column corresponds to a species (named as in [28], table S1)) and input processes are labelled on the vertical axis. The upper, central and lower regions of the plot correspond to the outputs AP1-JUN, ISRE-IRF3 and NADPH-OX-3P, respectively. Each row in the matrix indicates the species composition of a given edge on an I–O path, with edges colour-coded (as in figure 5). Rows of the matrix are grouped according to the individual I–O combinations and ordered within a group from top to bottom according to the sequence of the edges in the corresponding I–O path in 𝒯M in figure 5.

