Figure 4.
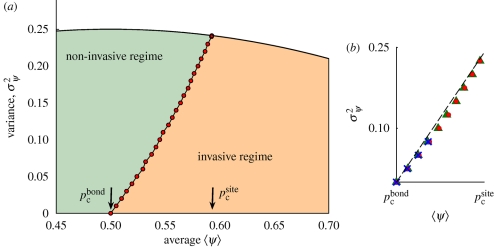
(a) Phase diagram in the (〈ψ〉, σψ2 ) plane for a system with site heterogeneity. The points of the phase boundary separating the invasive and non-invasive regions (red points) were calculated numerically for the family of bimodal probability distributions for ψ given by equation (3.1a) with ψB = 0. The accessible points lie below the curve σψ2 = 〈ψ〉 (1 − 〈ψ〉). The values of σψ2 are exact; the error on the values of 〈ψ〉 is about 0.01Δp, Δp = pcsite − pcbond. (b) Points of the phase boundary on the same lattice for different families of distributions: bimodal with ψB = 0 (red circles), β distribution (green triangles), truncated Gaussian (blue crosses). The difference along the 〈ψ〉 axis between points for different distributions is less than 0.03Δp. The points lie approximately on a straight line (dashed black line).

