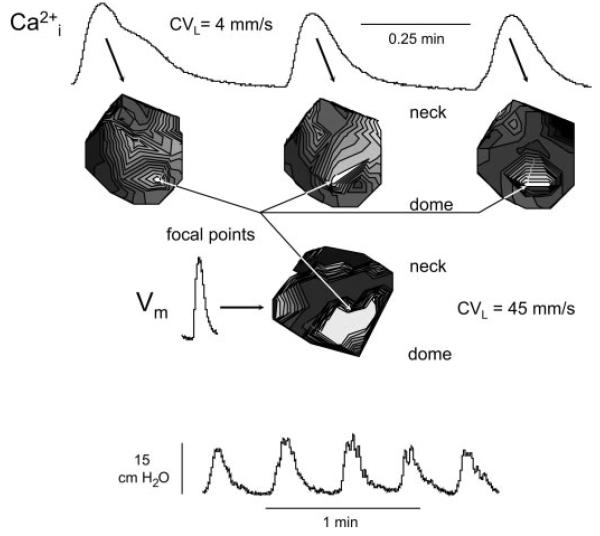
Fig. 4.
Ca2+ and membrane potential transients in the neonatal rat bladder. Top traces: successive Ca2+ transients above the corresponding isochronal maps. Middle trace: membrane potential transient and the associated isochronal map corresponding to middle Ca2+ transient above. Bottom traces: spontaneous intravesical pressure changes, with the middle 3 corresponding to the Ca2+ and the middle one corresponding to the membrane potential transients shown above. Isochrones represent successive conductions delays of 44 ms for the Ca2+ array and 4 ms for the membrane potential array.

