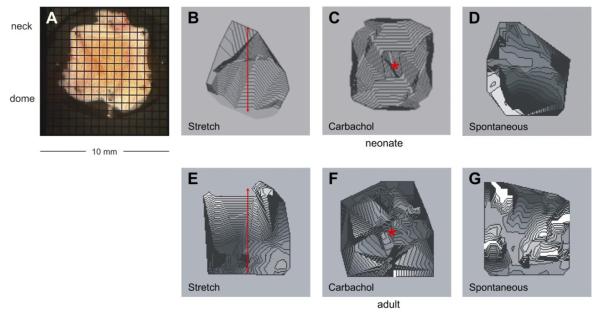
Fig. 7.
Ca2+ maps in sheets of bladder from neonatal (A–D) and adult (E–G) rats. A: bladder sheet from a neonatal rat with the mucosal face uppermost and a superimposed photodiode array grid. The positions of the dome and neck of the bladder are shown. B and E: isochronal Ca2+ maps after stretch (0.8 mm or 10%) in the neck-dome axis, indicated by the double headed arrows. C and F: isochronal Ca2+ maps after the topical application of carbachol (50 nM), indicated by *. D and G: spontaneous isochronal Ca2+ maps. Isochrones represent successive conduction delays of 44 ms (B–D) and 89 ms (E–G).

