
Figure 5.
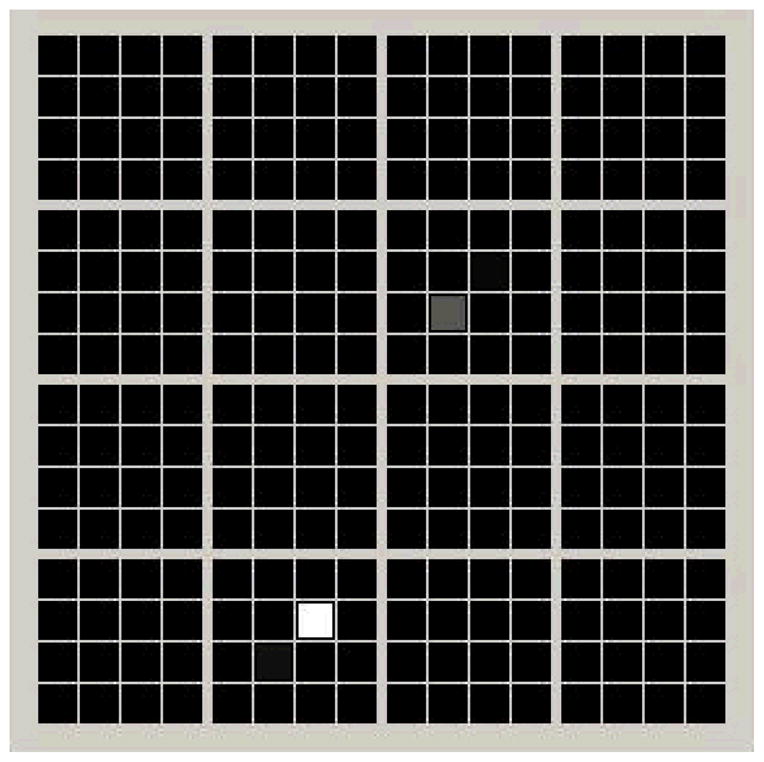
Readout of SiPM Array. A 16×16 array of 3 mm square SiPM elements is read out using a row and column scheme. LSO crystals of different lengths are placed over two of the pixels. The intensity of each pixel in the display is proportional to the event rate in that pixel times the average energy deposited per event. As expected, all but two of the pixels are black, and the pixel with the larger crystal is brighter.