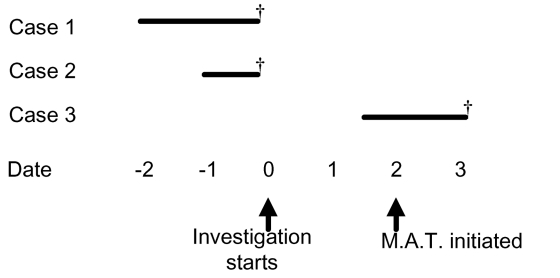
Figure 3.
Timeline for outbreak 2. Solid lines represent the time of onset and duration of illness among three cases with invasive GAS infection in outbreak 2, relative to the initiation of the outbreak investigation (date=0). Daggers (†) denote death. Mass antibiotic treatment was started 2 days after the investigation was initiated.

