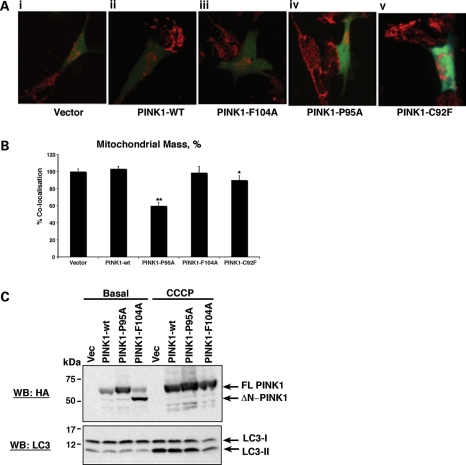
Figure 3.
PINK1 cleavage status affects the mitochondrial network and mass. (A) Failure to cleave PINK1 results in an abnormal mitochondrial network and altered location. Images display SH-SY5Y cells expressing the indicated PINK1 pIRES constructs (green cells) and neighbouring untransfected control cells where only mitochondria are visible. Image (i) shows the normal mitochondrial network observed in cells expressing vector control; (ii) PINK1-wt; (iii) PINK1-F104A; (iv) the loss of mitochondrial network and presence of aggregated mitochondria in cells expressing PINK1-P95A; (v) the intermediate phenotype between PINK1-wt and PINK1-P95A observed in cells expressing the PD PINK1-C92F mutant protein. Mitochondria were visualized using TMRM dye. 3D movies are provided in Supplementary Material, Figures S1–S5. (B) Mitochondrial mass appears reduced in cells predominantly expressing FL-PINK1. Cells expressing PINK1-P95A or PINK1-C92F PD mutant protein show significantly reduced mitochondrial mass compared with vector-, PINK1-wt- and PINK1-F104A-expressing cells. Vector control-transfected cells were taken as 100%. (C) Loss of mitochondrial mass through expression of PINK1-P95A does not correlate with autophagy induction. Cells stably expressing either vector control, PINK1-wt, PINK1-P95A or PINK1-F104A were exposed to DMSO control or CCCP for 12 h prior to lysis. Lysates were analysed by WB with an anti-HA antibody (PINK1) and LC3 antibody to detect autophagy activation by LC3I-II cleavage. Expression of PINK1-P95A did not induce an increase in LC3I-II cleavage at basal levels compared with vector control, PINK1-wt or PINK1-F104A cells. CCCP treatment of all cell lines induced LC3I-II cleavage and suppressed PINK1 cleavage in all cell lines.

