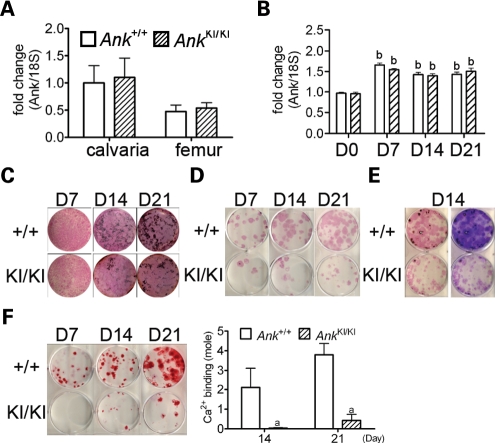
Figure 1.
Ank expression, matrix and mineral formation in osteoblast cultures. qPCR of Ank expression (A) in calvarial and femoral bone and (B) during in vitro calvarial osteoblast differentiation. Data were normalized to 18S RNA. Data presented are average with SD from three independent experiments. bP < 0.01 indicates significant difference in fold-change compared with Ank+/+ calvarial osteoblasts at day 0. Expression in Ank+/+ calvaria and Ank+/+ calvarial osteoblasts at day 0 were used as calibrators. No difference between Ank+/+ and AnkKI/KI groups at any time point. (C) Ank+/+ and AnkKI/KI mCOBs stained for ALP and von Kossa at culture days 7, 14 and 21. AnkKI/KI cultures show reduced mineral nodule formation. (D) Ank+/+ and AnkKI/KI BMSCs stained for ALP at culture days 7, 14 and 21. (E) Ank+/+ and AnkKI/KI BMSCs stained for ALP followed by von Kossa staining (left panel) and crystal violet (right panel) at day 14. (F) Ank+/+ and AnkKI/KI BMSCs stained for alizarin red S at culture days 7, 14 and 21. Histogram represents corresponding calcium-binding levels. aP < 0.05 indicates significant difference.

