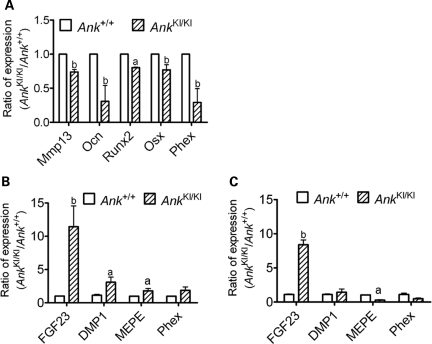
Figure 3.
Gene expression in mCOBs and bone tissues from Ank+/+ and AnkKI/KI mice. (A) qPCR of decreased Mmp13, Ocn, Runx2, Sp7 (Osx) and Phex in day 21 AnkKI/KI calvarial osteoblast cultures normalized to expression levels of Ank+/+ cells. Data from three independent experiments were pooled. aP < 0.05, bP < 0.01. (B) qPCR analysis of Fgf23, DMP1, MEPE and Phex in calvariae and (C) in femurs. RNA samples isolated from 8- to10-week-old Ank+/+ and AnkKI/KI mice.

