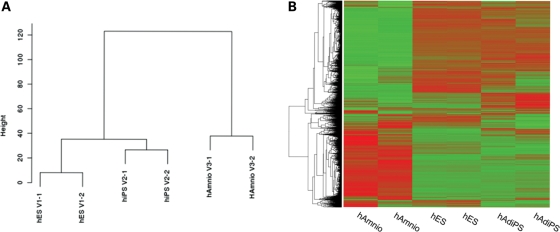
Figure 4.
(A) Dendrogram and (B) heatmaps showing relationship between two independent samples of each of hES cells, hAdiPS cells and human amniocytes. The expression values within heatmaps represent the fold difference of expression from the ES cell lines calculated by the logarithm (base 2) of the ratio between the expression level for a gene between the average expression of the ES cell lines for that particular gene. Heatmaps were prepared using unsupervised hierarchical clustering.

