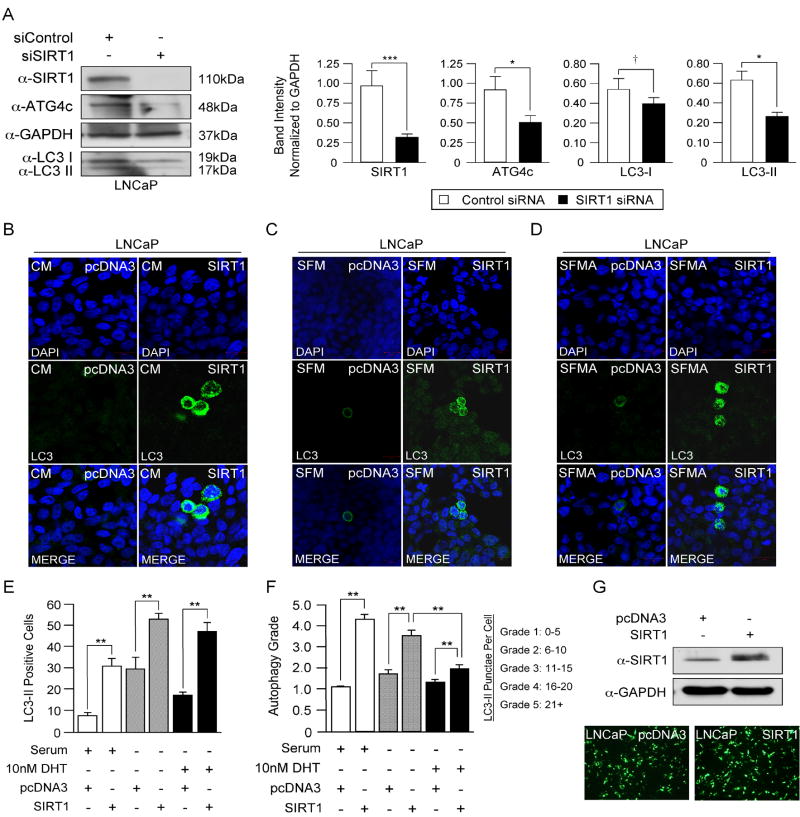
Figure 3. SIRT1 Antagonizes AR-Mediated Inhibition of Autophagy.
(A) Western blot for SIRT1, ATG4c, and LC3 following SIRT1 siRNA treatment in LNCaP cells. All data are representative of triplicate experiments. Statistical significance was determined by Student's t-test (*P<0.05, ***P<0.001, † denotes no statistical significance). (B-D) LNCaP cells transfected with pcDNA3 or SIRT1 and cultured in complete serum media (CM), serum free media (SFM), or serum free media supplemented with 10nM DHT (SFMA) were subjected to LC3-II immunofluorescence (see also Figs. S2A-S2C). (E,F) Quantitation of autophagic cells based on LC3-II positivity (ANOVA, **P<0.01) and autophagic grade (Mann Whitney U, **P<0.01). All data are representative of triplicate experiments. Quantitation represents at least 100 cells counted and scored per treatment. (G) SIRT1 Western blot following co-transfection with pcDNA3 vector control or SIRT1 and GFP (micrographs confirm GFP-positive cells post-transfection).

