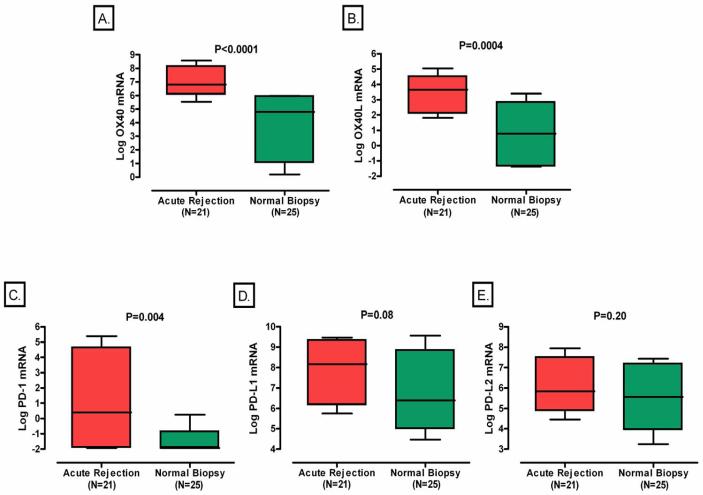
Figure 1. Levels of mRNA in Urinary Cells.
Boxplots show the 10th, 25th, 50th, 75th, and 90th percentiles of log-transformed 18S-normalized mRNA levels for OX40, OX40L, PD-1, PD-L1, or PD-L2 in urine samples obtained from 21 subjects with graft dysfunction and biopsy-proven acute rejection and 25 subjects with stable graft function and normal biopsy results. The levels of mRNA for OX40 (Panel A), OX40L (Panel B) and PD-1 (Panel C), but not the levels of mRNA for PD-L1 (panel D) or PD-L2 (panel E) were significantly higher in urinary cells from subjects with acute rejection (Acute Rejection) than in the subjects with stable graft function and normal biopsy results (Normal Biopsy). Two-tailed P-values are based on Mann-Whitney test. In all cases, the natural log transformed values of 18S-normalized mRNA levels are shown.

