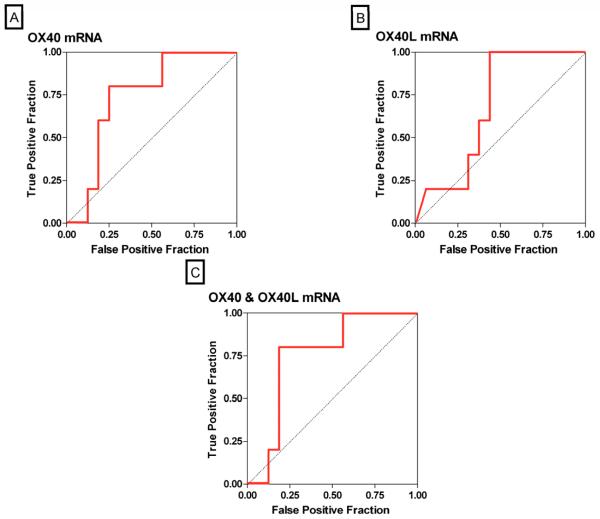
Figure 5. Receiver-Operating-Characteristic Curves of mRNA Levels for Predicting Graft Loss.
The fraction of true positive results (sensitivity) and false positive results (1-specificity) for levels of mRNA, each normalized for 18S rRNA, are displayed as predictors of graft loss within 6 months of biopsy proven acute rejection. The calculated area under the curve was 0.74 (95 percent confidence interval, 0.51 to 0.97) for OX40 mRNA levels (P=0.04, Panel A), 0.68 (95 percent confidence interval, 0.44 to 0.92) for OX40L mRNA levels (P=0.14, Panel B), 0.75 (95 percent confidence interval, 0.52 to 0.98) for the best linear combination of levels of mRNA for OX40 and OX40L (P=0.04, Panel C). A value of 0.5 is considered no better than predicted by chance and a value of 1.0 is considered a perfect indicator.

