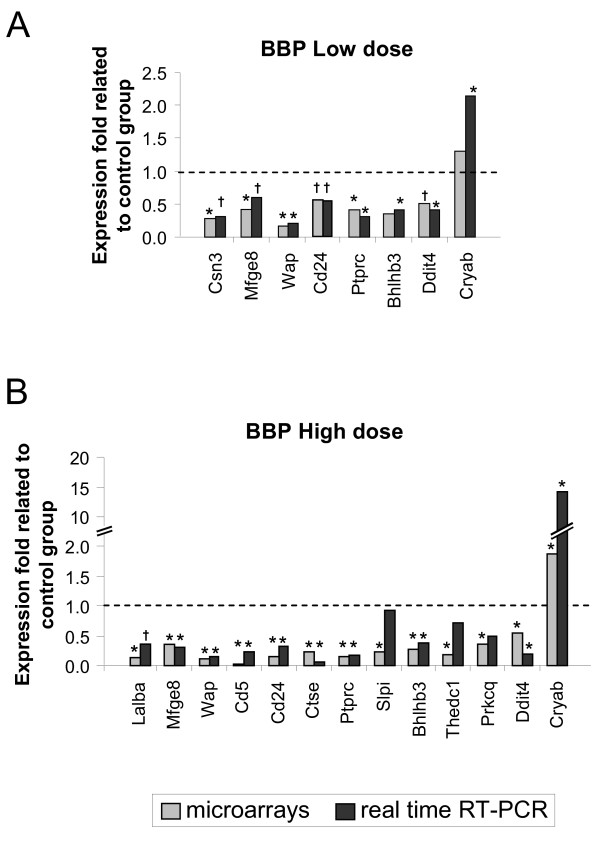
Figure 3.
Gene expression analyses of the mammary gland by real time PCR. Gene expression analyses by real time RT-PCR and comparison with results from microarrays. Grey bars represent results obtained in the microarrays, black bars represent results obtained in the real time RT-PCR. Results show the mean fold expression of each treated group related to the mean of the control group. *: statistically significant changes (p < 0.05); †: changes close to significance (0.1 > p > 0.05).

