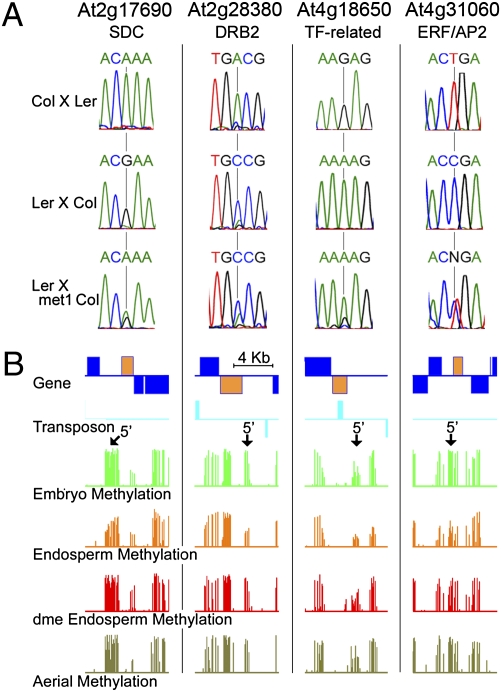
Fig. 2.
Maternally expressed imprinted genes. (A) RT-PCR sequencing chromatographs at selected SNP regions measuring allele-specific expression in reciprocal crosses between Ler and Col ecotypes and in female Ler crossed to male met1-6 Col-gl. (B) CG methylation profiles in WT embryo, endosperm, aerial tissues, and dme endosperm for genes shown in A are displayed. Genes and transposable elements oriented 5′ to 3′ and 3′ to 5′ are shown above and below the line, respectively. Gene models indicated in yellow represent the imprinted genes as shown in A. Arrows indicate the 5′ end of imprinted genes where CG demethylation is seen in WT endosperm.

