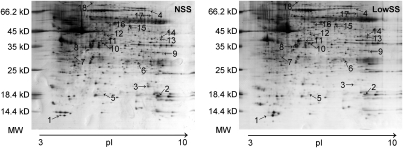
Fig. 1.
Typical 2D electrophoresis gel maps of NSS- and LowSS-cultured vessels. The horizontal axis represents the isoelectric focus dimension that separated proteins by their isoelectric point (pH 3–10 NL). The vertical axis represents 12% SDS/PAGE gel, which separated proteins according to their molecular weight (MW). Arrows point to proteins that are differentially expressed between two levels of shear stress and integrated by IPA (nodes with gray background in Fig. 2). Proteins corresponding to numbers 1 to 4 were highly expressed in vessels cultured under NSS, and numbers 5 to 18 were highly expressed in LowSS. The names of these spots are listed in Table S2.

