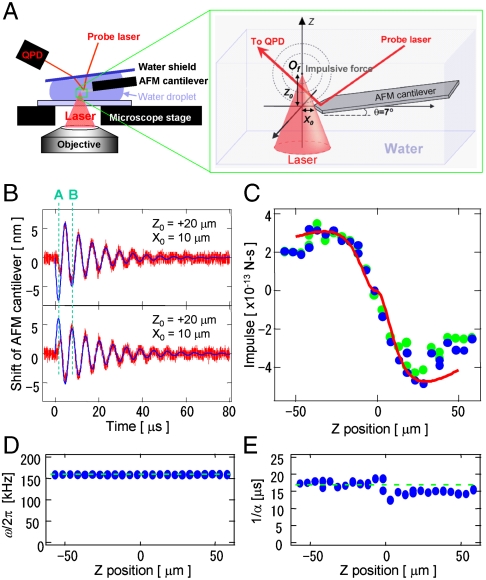
Fig. 1.
Measurement of the femtosecond laser impulse by AFM. (A) Experimental setup of the AFM-assisted impulse measurement system. (B) Transient oscillations of an AFM cantilever induced by an fsLP when Of is higher (top side) or lower (bottom side) than the AFM cantilever tip. The red and blue lines indicate the observation data and fitting results using Eq. 1, respectively. (C–E) The Z-position dependence of the impulse of F (C), oscillation frequency of ω/2π (D), and damping time of 1/α (E) that were estimated from the oscillations of the AFM cantilever. The blue dots are the result of least-square fitting of Eq. 1 when F, ω, and α were treated as variable parameters. The green dots in Care the fitting results when ω and α were treated as constants, indicated as green broken lines in D and E. The red line in C is the Z-position dependence of the total impulse calculated by Eq. 2.

