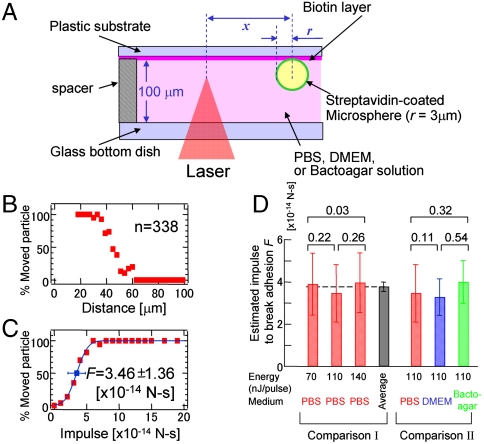
Fig. 3.
Femtosecond laser-induced movement of streptavidin-coated microspheres that adhered to a biotin-coated substrate. (A) Schematic presentation of the method used to load the fsLP-IF onto a streptavidin-coated microsphere adhering to biotin-coated substrate. (B and C) Histograms of the percentage of particles that moved by the fsLP-IF as a function of the distance between the laser focal point and the sphere center (B) and of the impulse estimated by Eq. 3 (C). A femtosecond laser with a pulse energy of 110 nJ/pulse was focused into the PBS medium. The blue line in C is the least-square fitting of Eq. 4. The blue box and error bar on the line indicate F and δF in the function, respectively, corresponding to the estimated median impulse and its standard deviation to break the interaction. (D) Comparison I: F (solid bar) and δF (error bar) estimated in PBS medium by 70-, 110-, and 140-nJ pulses and their average. Comparison II: F and δF estimated in PBS, DMEM, and a 0.2% bactoagar solution by a 110-nJ pulse. Numbers at the top of the bar graph indicate the Z score calculated as Z = |F1-F2|/[(δF1)2-(δF2)2]1/2. When Z is < 1.96, there is no significant difference between the median impulses F1 and F2 (P < 0.05).

