Fig. 4.
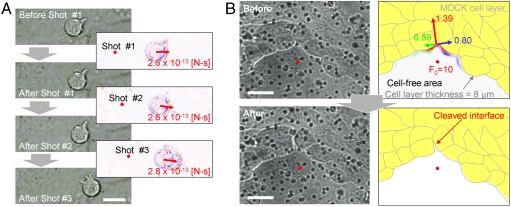
Femtosecond laser-induced intercellular dissociation of HL-60 leukocytes attached to HUVECs (A) and the MDCK cell–cell interface (B). (A) Left, microphotographs of an adherent HL-60 leukocyte before and immediately after irradiation with three serial laser pulses. Right, differential images between the left-top and left-bottom microphotographs. Blue and red contrasts indicate the degree to which the brightness is increased and decreased, respectively. Bar = 10 μm. The laser focal point and impulse loading on the leukocyte are indicated as red dots and red arrows, respectively. The value of the impulse was estimated by Eq. 3. (B) Microphotographs (left) and their graphics (right) of an MDCK cell monolayer before (top side) and after (bottom side) the laser irradiation. Multiple black dots in the left photographs are the pores of the permeable filter on which the MDCK cells were cultured. The laser was focused on the cell-free area at the positions indicated with red dots in the photographs and graphics. In the top graphic, the magnitudes of the impulse loaded onto the margin of the MDCK cell monolayer are described as a contour of the margin with RGB colors. The impulse is divided into three directions: parallel to the direction from the laser focal point to the cleaved interface among MDCK cells (red arrow), and the directions that are perpendicular to the right (blue arrow) and left (green arrow) of the red arrow. The depth of the color gradation indicates the magnitude of the impulse. The total magnitudes are indicated by the arrow length and are displayed beside each arrow. The unit of these impulses and F0 is × 10-12 [N-s]. Bar = 10 μm.

