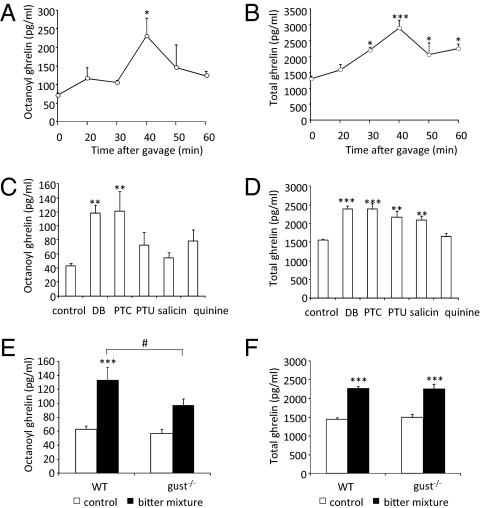
Fig. 3.
(A and B) Time-dependent increase in plasma octanoyl ghrelin and total ghrelin levels in response to oral gavage of T2R-agonists in WT mice (n = 4–6). (C and D) Comparison of the effect of gavage of individual T2R agonists on octanoyl ghrelin and total ghrelin secretion (n = 6–8). (E and F) Octanoyl and total plasma ghrelin levels after gavage of T2R-agonists (40 min) in WT (n = 18–21) and gust−/− (n = 18–19) mice. *P < 0.05, **P < 0.01, ***P < 0.001 vs. control; #P < 0.05 WT vs. gust−/−.

