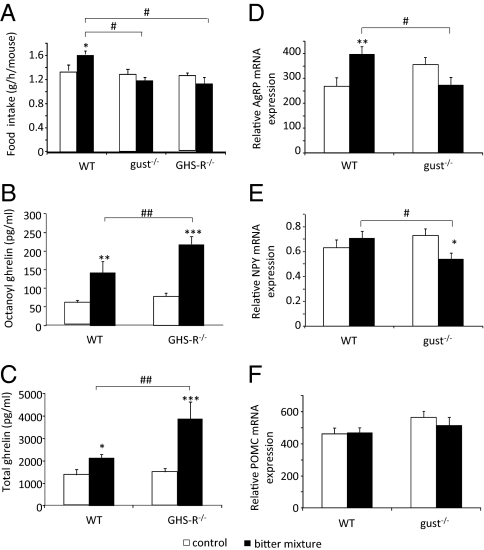
Fig. 4.
(A) Effect of T2R-agonists on food intake in WT (n = 28–32), gust−/− (n = 26–32), and GHS-R−/− (n = 12–14) mice during the first 30 min after gavage. (B and C) Effect of gavage of T2R-agonists on plasma octanoyl and total ghrelin levels in WT (n = 6–7) and GHS-R−/− mice (n = 5–7). (D–F) Changes in the mRNA expression of AgRP (D), NPY (E), and POMC (F) in the hypothalamus after intragastric gavage of water or T2R-agonists in WT (n = 17–18) and α-gust−/− mice (n = 16–20). *P < 0.05, **P < 0.01, ***P < 0.001 vs. control; #P < 0.05 WT vs. gust−/− or GHS-R−/−, ##P < 0.01 WT vs. GHS-R−/−.

