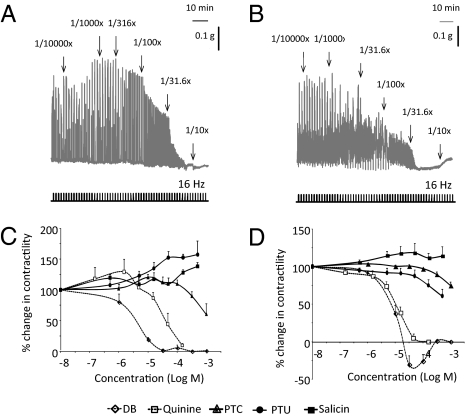
Fig. 7.
(A and B) Representative tracings of the effect of different dilutions of T2R-agonists on neural responses in antral (A) and duodenal (B) smooth-muscle strips of WT mice in vitro. (C and D) Cumulative concentration-response curves of T2R-agonists in antral (C) or duodenal (D) smooth muscle strips (n = 3–4).

