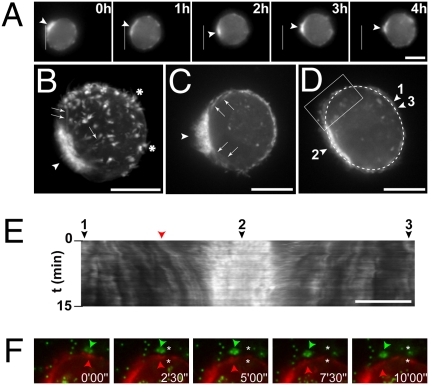
Fig. 2.
F-actin dynamics during MDA-MB-231 rounded cell 3D migration. MDA-MB-231 cells expressing mCh-Lifeact were seeded in Matrigel containing fluorescent microbeads (green in F) and imaged by wide-field (A) or confocal spinning disk (B–F) microscopy. (A) Selected frames from a time-lapse sequence with the white line showing the position of the rear of the cell at the beginning of the sequence. Arrowheads point to accumulation of F-actin at the cell rear in a uropod-like structure. (B) Z-projection of confocal sections (see Movie S3 for 3D reconstruction) showing the accumulation of F-actin at the uropod (arrowhead), in finger-like cortical extensions (asterisks), and in bundles radiating from the uropod toward the cortex (arrows). (C) Selected frame of a time-lapse series (Movie S4) showing intense blebbing activity restricted to the uropod region (arrowheads). Arrows point to radial F-actin bundles. (D and E) Selected frame (D) of a time-lapse series (Movie S6) showing the dashed line used for kymographic analysis of cortical movements in E (tags 1–3 are positioned on the x axis of the kymograph, as well as the cortical structure highlighted in F, shown by a red arrowhead). (F) Selected frames from the time series as in D and E (Movie S6). The region depicted is boxed in D. Images show F-actin labeled with mCh-Lifeact (red) and microbeads (green). Arrowheads point to parallel rearward movement of a cortical actin structure (red arrowhead) and microbeads (green arrowhead). Asterisks, position of the objects at time 0. (Scale bars, 10 μm.)

