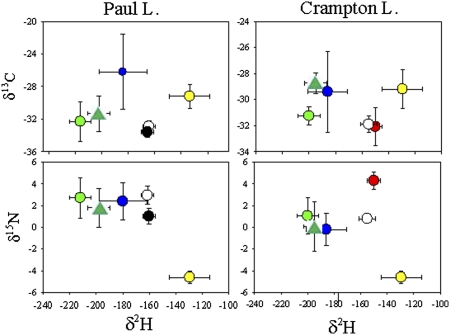
Fig. 1.
Isotope biplots for Paul (Left) and Crampton lakes (Right) for 2009. Zooplankton [Daphnia (Paul; filled black circles); Holopedium (both lakes, open circles); and Leptodiaptomus (Crampton, filled red circle] are shown in relation to possible food sources: phytoplankton in the upper mixed layer (green filled circle); deep water phytoplankton (dark green triangle); littoral benthic algae (filled blue circle), and terrestrial vegetation (filled yellow circle). Means and SDs are shown; in some cases, the symbols are larger than the SDs. Zooplankton are averages for all depths and dates taken. For surface water phytoplankton, SDs combine variance over time and the depths within the upper mixed layer; for periphyton and deep water phytoplankton, the SDs are temporal only. POM, not shown here, is shown in Fig. S1.

