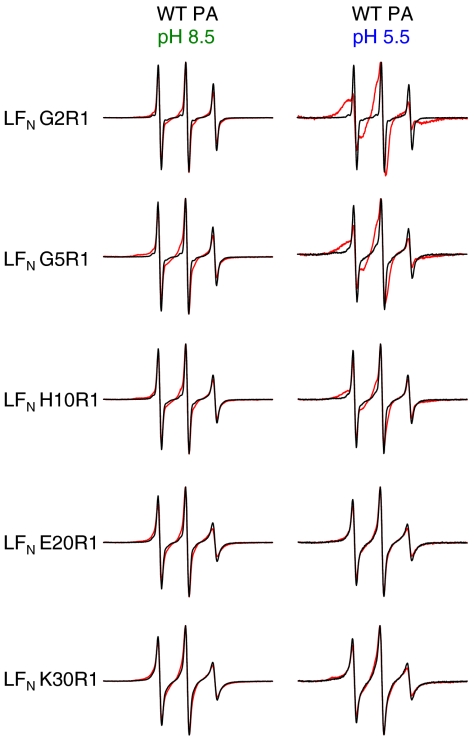
Fig. 2.
LFN residues 2, 5, and 10 interact with PA pore. Shown are EPR spectra of spin-labeled LFN variants with and without WT PA. Black line—LFN alone. Red line—with WT PA (1∶1 molar ratio  heptamer). (Left) Spectra collected at pH 8.5 (when PA is in the prepore conformation). (Right) Spectra collected at pH 5.5 (when PA is in the pore conformation). Spectra were collected at room temperature and normalized to the intensity of the central peak.

