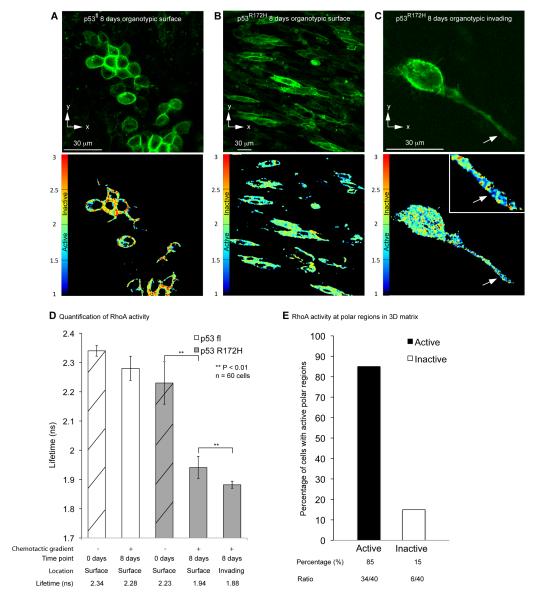
Figure 3.
Spatial regulation of RhoA activity during invasion. A-C, Representative fluorescence images of p53fl and p53R172H cells expressing the Raichu-RhoA reporter (green) on the matrix surface or during invasion with corresponding life-time map of RhoA activity. D, Quantification of life-time measurements of RhoA activity at 0 (dashed columns) and 8 days for cells on and within the matrix surface for both p53fl and p53R172H PDAC cells, respectively. E, Percentage of p53R172H PDAC cells demonstrating distinct RhoA activity at the poles of cells within the three-dimensional matrix. White arrow demonstrates distinct RhoA activity at the pole of the cell. Columns, mean; bars, SE. **, P < 0.01

