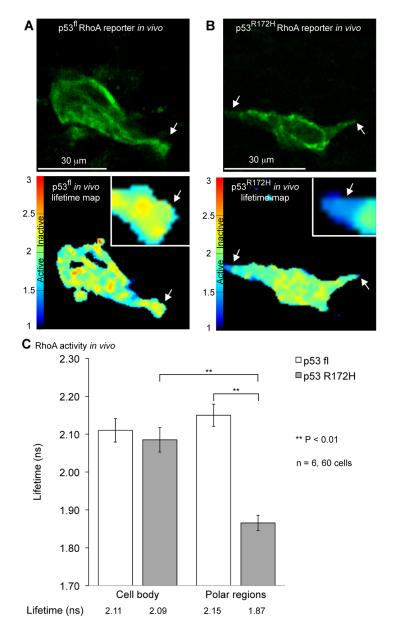
Figure 4.
Spatial regulation of RhoA activity in live animals. A,B Representative in vivo fluorescence images of p53fl and p53R172H PDAC cells expressing the Raichu-RhoA reporter (green) with corresponding in vivo life-time map of RhoA activity, respectively. C, Quantification of life-time measurements of RhoA activity within the cell body or poles of p53fl and p53R172H PDAC cells in live animals as indicated. Columns, mean; bars, SE. **, P < 0.01

