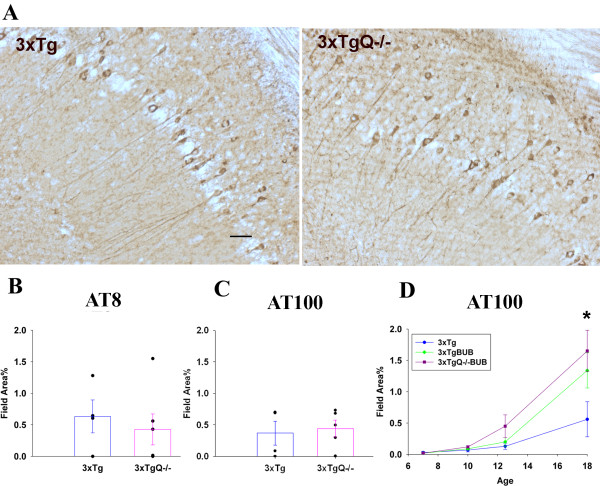
Figure 3.
Neurofibrillary tangles/phosphorylated tau pathology was similar in the 3xTg and 3xTgQ-/- mice, while a significant increase was seen in the 3xTg BUB. A. AT8 immunostaining in the subiculum area of the 3xTg and 3xTgQ-/- mice at 16 m. Scale bar: 50 um. B, C. AT8 and AT100 quantification by image analysis in the subiculum of the 3xTg and 3xTgQ-/- mice at 16 m. AT8 n = 4,6, AT100 n = 4,5 (data is representative from two different trials for the AT100). Data points are individual animals. D. AT100 quantification at different ages in the 3xTg, 3xTgBUB and 3xTgQ-/-BUB. Points are the average of n animals +/- SE at different ages. 3xTg, 3xTgBUB, 3xTgQ-/-BUB at 7 m n = 3,3,5; at 10 m n = 8,3,8; at 12.5 m n = 7,7,8; at18 m n = 4,5,6. *p < 0.05 (3xTg vs 3xTgBUBQ-/-) using ANOVA single factor.

