FIG. 8.
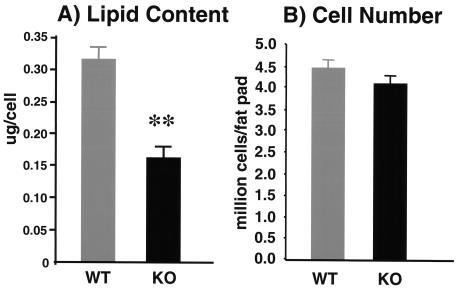
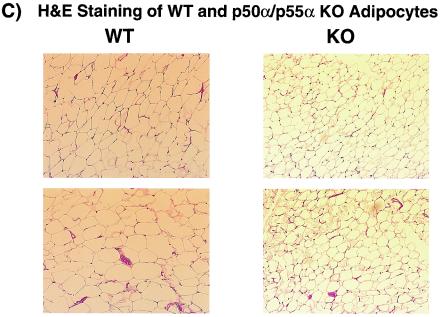
Lipid contents (n, nine in each group) (A), cell numbers (n, nine wild-type and eight knockout mice) (B), and hematoxylin and eosin (H&E) staining (C) of isolated adipocytes from 5-month-old wild-type (WT) and p50α/p55α knockout (KO) mice. Values in panels A and B are expressed as means ± SEM (**, P < 0.01). In panel C, each field is a representative hematoxylin-and-eosin-stained image from a separate animal of the indicated genotype.


