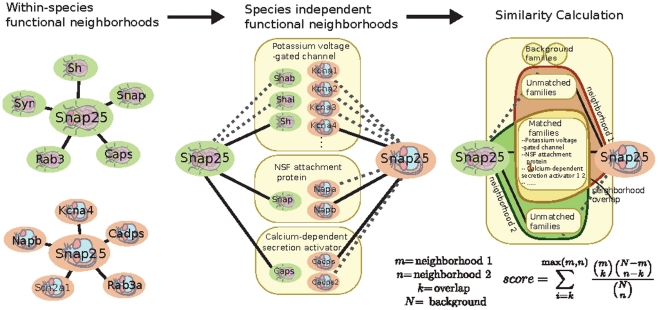
Figure 1. Overview of the functional similarity calculation method.
Species-specific functional networks are derived by Bayesian integration of microarray data. For each intra-species pair of genes, the networks associate a probability of functional relationship based on their pattern of correlation. For a single gene, the set of genes with high probabilities of being functionally related to it defines a functional neighborhood. To make functional neighborhoods comparable across organisms, neighbors are grouped into meta-genes according to their Treefam families. The network similarity score is then defined as the hypergeometric probability of the overlap obtained from intersecting the sets of species-independent Treefam families present in each species-specific functional neighborhood. Such intersection analysis enables identification of specific biological processes responsible for network similarity scores. We have taken a comparison between the mouse and fly Snap25 genes as the basis for the schematic figure. The overlap meta-genes are a selection and the complete overlap can be viewed online using our webserver.

