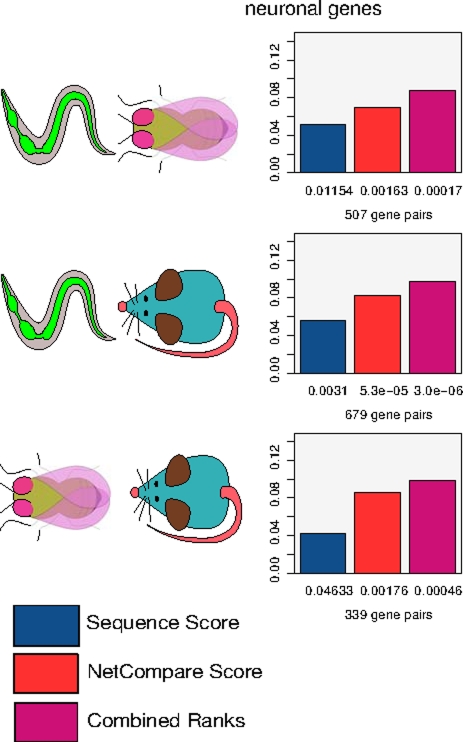
Figure 2. Network similarity score correctly identifies homologs with shared expression in the nervous system.
We consider single query genes that are known to express in the nervous system and have multiple homologs in another organism (according to Treefam family co-membership), with at least one of the homologs also expressed in the nervous system (“correct” functional homolog), and another whose expression has been evaluated but was not detected in the nervous system (“incorrect” functional homolog in this evaluation). We then evaluate how well the various metrics rank the homologs consistent with their nervous system expression by computing the AUCs of homolog rankings (normalized per query gene). Numbers below the bars represent the p-value that corresponds to the AUC score.

