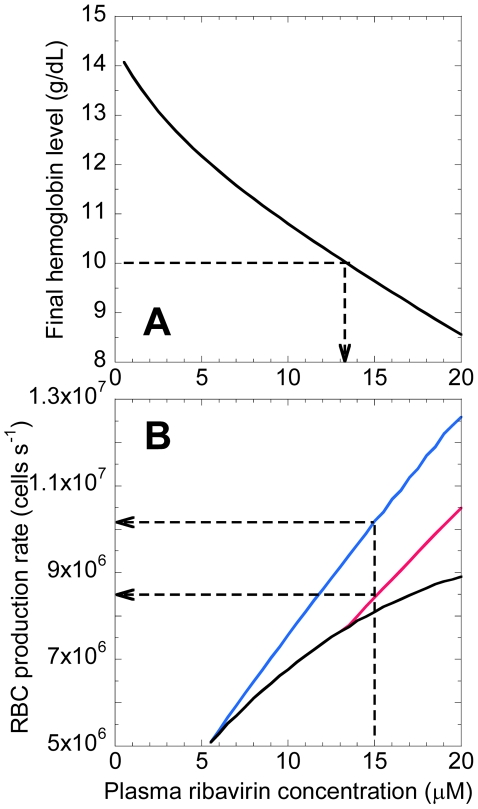
Figure 6. Model predictions of threshold ribavirin exposure and requisite RBC production.
A, Prediction of  as a function of
  . The arrow indicates the threshold
  above which
  <10 g/dL. B, Predictions of the RBC production rate during therapy (black) and the production rate required to maintain
  of 10 g/dL (pink) and 12 g/dL (blue) as functions of
  . The arrows indicate the desired production rates when
  . Parameter values employed are mentioned in Table 1.

