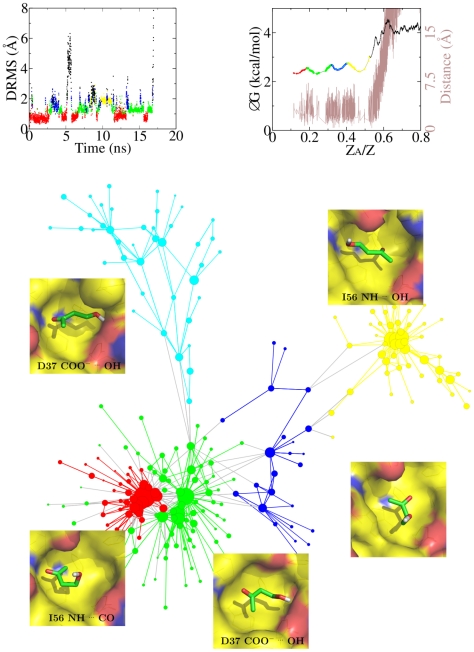
Figure 2. Multiple binding modes of BUT.
The binding modes of BUT in the active site of FKBP, i.e., the subbasins
within the bound state, were determined by the cut-based FEP approach
[13] and are shown by different colors. (Top,left)
Time series of DRMS from the X-ray structure of the BUT/FKBP complex
[30] for one of the 50 MD runs at 310 K. The
majority of MD snapshots in the most populated subbasin (red) have a
DRMS smaller than 1.0 Å. The interconversions between subbasins
are evident. The time series of other 20 MD runs are shown in Fig. S1 in
Text
S1. (Top,right) Cut-based FEP at 310 K and distance between
centers of mass of BUT and FKBP active site with y-axis on the left and
right, respectively. The most populated node is employed as reference,
and the relative partition function Z /Z is used
as reaction coordinate as it takes into account all routes from the
reference state [13]. The cyan and blue nodes overlap in the third
subbasin from the left because they have the same kinetic distance from
the reference node. (Bottom) Network representation [11] of the
bound state of BUT. Nodes and links are the conformations (i.e.,
clusters obtained by DRMS clustering) and direct transitions (i.e.,
within 4 ps), respectively, sampled in the 50 MD runs at 310 K. The size
of each node is proportional to the natural logarithm of its statistical
weight, and only nodes connected by at least one link of weight
 are shown
to avoid overcrowding. Links connecting pairs of nodes in the same
subbasin have the same color of the subbasin, otherwise they are gray.
In the insets close to each basin, the FKBP surface is colored according
to atom type with carbon atoms surface in yellow while BUT is shown by
sticks with carbon atoms in green.

