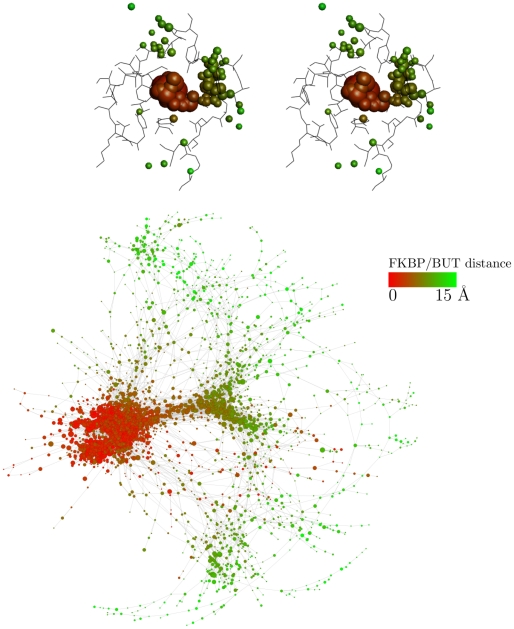
Figure 4. Multiple unbinding pathways.
The red/green coloring illustrates the distance between centers of mass
of BUT and FKBP active site. To illustrate the unbinding pathways, all
frames of the 50 MD runs are first overlapped in space [66]
using the coordinates of the C atoms of
FKBP. The different positions and orientations of BUT are then clustered
according to DRMS with a threshold of 1 Å. (Top) Stereoview of the
most populated clusters. The radius of the spheres is proportional to
the natural logarithm of the corresponding cluster population. (Bottom)
Ligand unbinding network colored according to the distance between BUT
and FKBP. Nodes and links are the clustered conformations and direct
transitions, respectively [11]. The size of each node is proportional to the
natural logarithm of its statistical weight. Only the 4184 nodes with
distance between the centers of mass of the ligand and FKBP active site
smaller than 15 Å were taken into account; of these, only the 2918
nodes with at least two MD snapshots are shown to avoid overcrowding.
Nodes of the bound state, i.e., those in Fig. 2, bottom, are all included in
the dense region of red nodes on the left.

