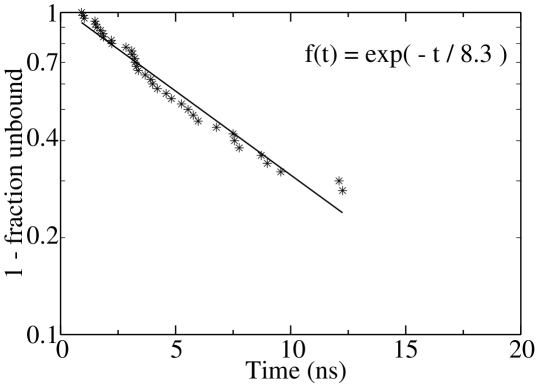
Figure 5. Single-exponential kinetics of unbinding.
The plot shows the cumulative distribution
 of the
unbinding times;
  , where
 is the
probability distribution of the unbinding time. An unbinding event is
defined by a separation between the centers of mass of the FKBP active
site and the ligand larger than 15 Å. The stars represent the 40
unbinding events observed in the 50 MD runs of BUT. The
single-exponential fit (solid line) yields
 ns.
ns.

