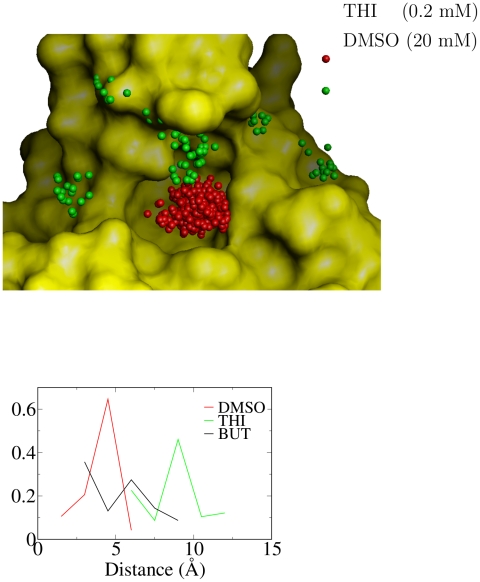
Figure 6. Unbinding TSE and Hammond behavior.
The structures belonging to the TSE were identified along the MD trajectories by a procedure based on the probability to unbind within a commitment time [22], [43]. A commitment time of 0.8 ns was used for all ligands, and individual conformations were assigned to the TSE if their unbinding probability was in the 0.45 to 0.55 range. (Top) The surface of FKBP is shown in gold while the positions of the centers of mass of the ligands at the TSE are shown by spheres. (Bottom) Distribution of distance between centers of mass of ligand and FKBP active site at the TSE. Note that the Hammond behavior, i.e., the shift of the TSE along the unbinding reaction coordinate, is robust with respect to the choice of the commitment time (Table S1 in Text S1).

