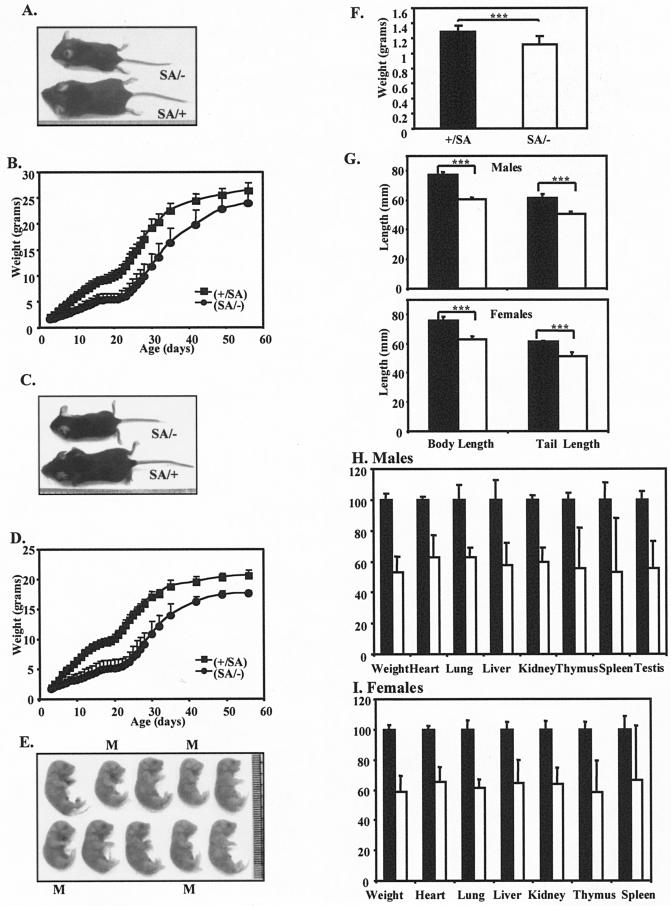
FIG.3.
Growth retardation of STAT3SA/− mice. (A) Representative male littermates at day P24. The mouse on top is SA/−, and the one on the bottom is SA/+. (B) Growth curves with standard deviations of STAT3+/SA (filled squares; total of 12 animals) and STAT3SA/− (filled circles; total of 8 animals) male mice from day P3 to 8 weeks of age. P was <0.0001 in the 2 to 6 weeks. (C) Representative female littermates at day P24. The top animal is SA/−, and the one on the bottom is SA/+. (D) Growth curves with standard deviations of STAT3+/SA (filled squares; total of 13 animals) and STAT3SA/− (filled circles; total of 6 animals) female mice from day P3 to 8 weeks of age. P was <0.0001. (E) A litter of E18.5 embryos showing reduced weight of SA/− mice during embryogenesis. The ones marked with an M are SA/−, and the rest are SA/+. (F) Weight of STAT3+/SA (11 pups) and STAT3SA/− (13 pups) embryos at E18.5. Three asterisks indicate that P was <0.001. (F) Body and tail lengths of STAT3+/SA and STAT3SA/− mice at 24 days of age. Top, males; bottom, females. Filled bar, SA/+; open bar, SA/−. Three asterisks indicate that P was <0.001. (G) Organ weights of STAT3+/SA (total of six animals) and STAT3SA/− (total of four animals) male mice at 24 days of age. The weight of each organ of the SA/+ mice was assigned as 100%. Filled bar, SA/+; open bar, SA/−. For liver and spleen, P < 0.01; for the rest, P < 0.001. (F) As for panel G but for female mice. Total of five SA/+ and six SA/− mice. Spleen, P = 0.016; for the rest, P < 0.0001.

