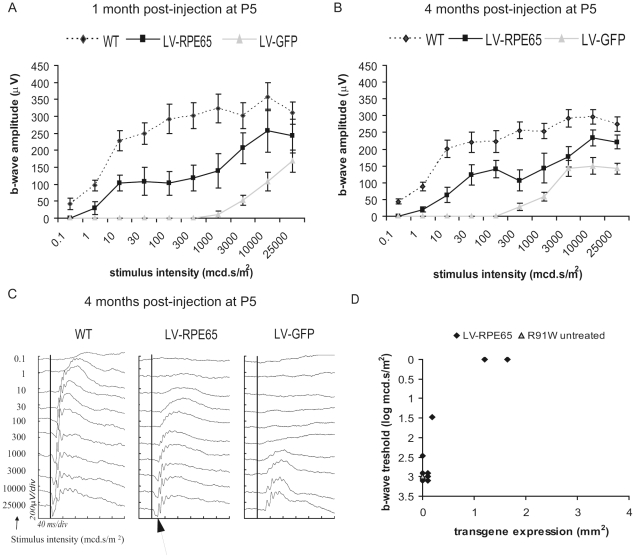
Figure 1. Lentiviral-mediated Rpe65 gene transfer at P5 in Rpe65R91W/R91W mice improved retinal sensitivity in scotopic conditions.
(A,B) Graphs representing the b-wave amplitudes of scotopic ERGs versus the intensity of the stimuli 1 month (A) and 4 months post injection (B) of Rpe65R91W/R91W mice treated at P5 showed an improved sensitivity of the response in the group of animals treated with LV-RPE65 (squares) compared to the group treated with LV-GFP (triangles). The response of the LV-RPE65 group was determined by the average response of eyes showing a positive RPE65 labeling (n = 3). Statistical analysis using an ANOVA for repeated measurements showed significant group, stimuli intensity and group versus stimuli intensity effects, p<0.01. For comparison, the scotopic response of age-matched wt animals (SV129) is shown (diamonds). Data are represented as mean ± standard error of the mean (SEM). (C) Representative ERG tracings of age-matched WT, LV-RPE65-treated and LV-GFP-treated eyes 4 months post injection at P5 illustrate the improvement of the scotopic response of LV-RPE65-treated eyes. Note the increase in the a-wave as well (arrow). The black vertical lines crossing the ERG tracings represent the stimulus time. (D) Plotting the b-wave threshold, corresponding to the lowest stimulus which induces an ERG response, to the transgene expression area shows that the improved b-wave threshold correlates with RPE65 expression. LV-RPE65-treated animals (diamonds) without noticeable transgene expression present a threshold similar to the average of age-matched untreated animals (triangle).

