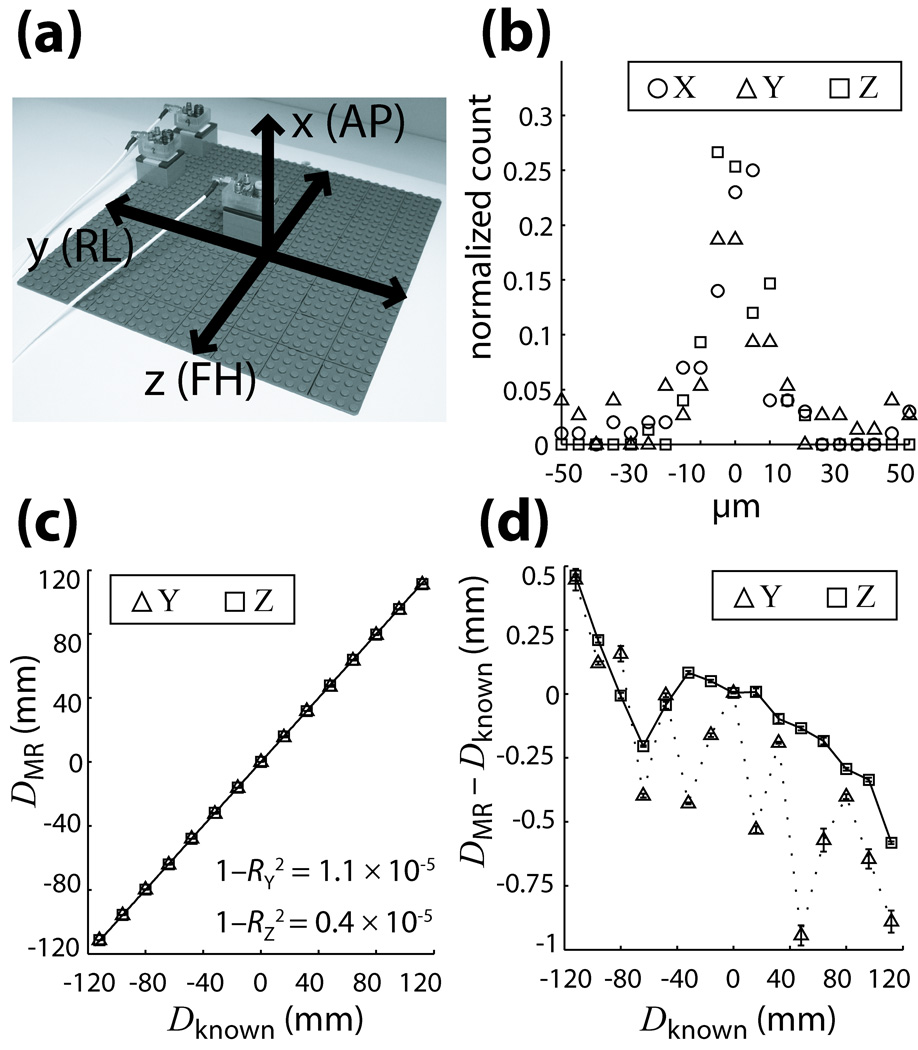
Fig. 4.
(a) Setup of grid for validation tests showing its orientation relative to gradient and patient axes. (b) Reproducibility of MR position measurements along the x,y,z gradient axes, illustrated as a histogram distribution of the deviation of each measurement from its corresponding mean. (c) Accuracy of measurements is displayed by comparing MR and caliper (known) measured distances along the y and z axes. Least-squares linear regression fits result in high correlation coefficients RY and RZ for both directions. (d) Measurement error between MR and caliper values as a function of distance. Error bars in (c,d) are the standard deviations of MR measurements at each position, reflecting the high reproducibility in (b). All curves are plotted with B0-corrected data; plots using positive readout gradients are similar in nature.

