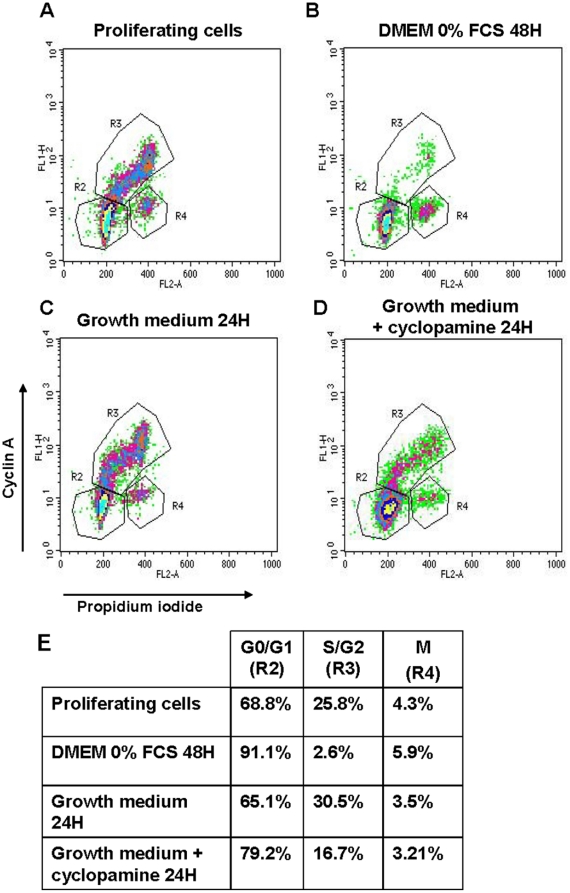
Figure 4. Inhibition of Hh signaling affects hMADS cell cycle.
Cell cycle distribution was evaluated by a Cyclin A antibody and PI double labelling and analysed by flow cytometry. (A): cell cycle distribution of proliferating hMADS. (B–D) hMADS cells were synchronised as described in “Methods” and (B) placed in DMEM in absence of serum for 48H or (C) incubated in growth medium (10%FCS and FGF-2 (2.5 ng/ml)) for 24H in absence or (D) in presence of cyclopamine (5 µM). (E) Distribution of cells in G0/G1 (R2 gate), S/G2 (R3 gate) or M (R4 gate) phases of the cell cycle are indicated in the table. Results are representative of three independent experiments.

