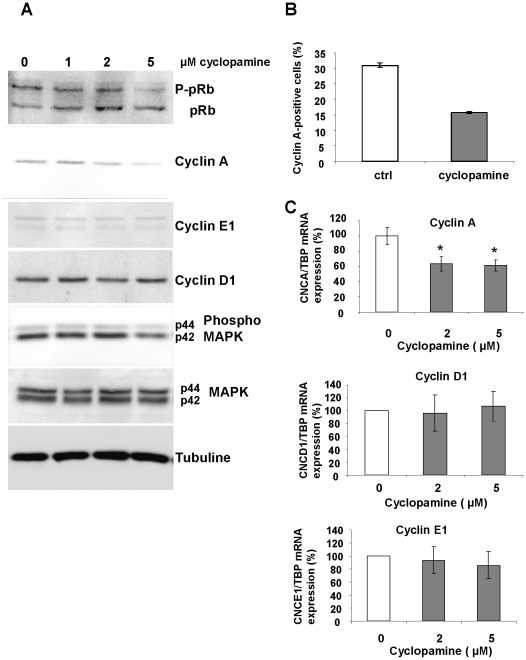
Figure 5. Inhibition of Hh signaling affects key markers of the cell cycle.
hMADS cells were synchronised as described in “Methods” and treated with increasing concentrations of cyclopamine for 24H. (A): Western blot of pRb (the upper band “P-pRb” is the hyperphosphorylated form of pRb), Cyclins A, E1 and D1, phospho-MAPK and total MAPK. Tubulin antibody was used as a loading control. Western blot are representative of experiments performed at least 3 times. (B): Flow cytometry analysis of cyclin A-positive cells after treatment with cyclopamine for 24H (5 µM). (C): Quantitative RT-PCR for Cyclins A, D1 and E1. Data are means ± SE of triplicates from an experiment representative of three independent experiments.

