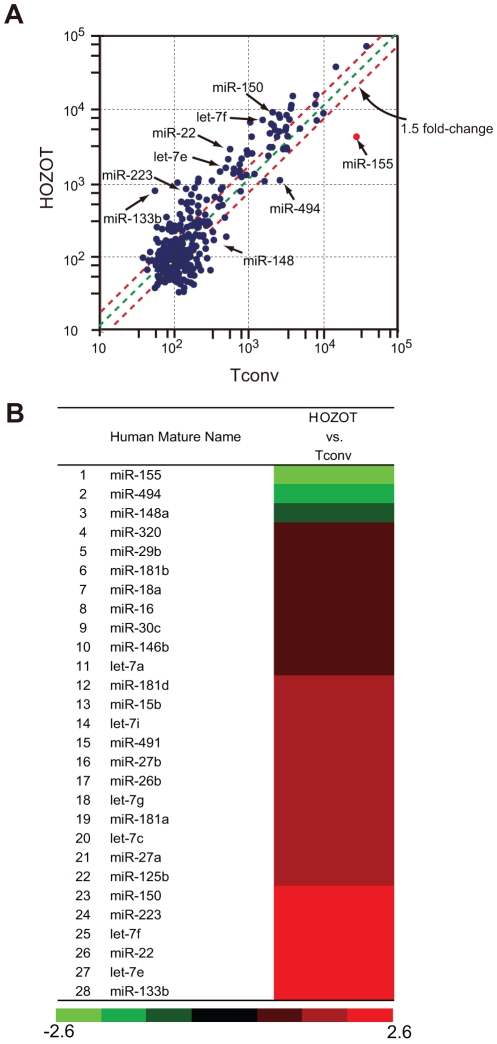
Figure 1. Downregulated expression of miR-155 in HOZOT revealed by miRNA microarray analysis.
A. miRNA array comparison of HOZOT versus Tconv cells. HOZOT-17 was used as a representative HOZOT cell line and an antibody-activated T cell line (prepared from the same UCB source) was used as Tconv cells. The expression value of each human miRNA was plotted as a scatter plot, and threshold lines were drawn at 1.5-fold expression change. B. miRNA profiling results displayed as a heatmap. Upregulated and downregulated miRNAs in HOZOT-17 in comparison with Tconv are shown in green and red, respectively.

