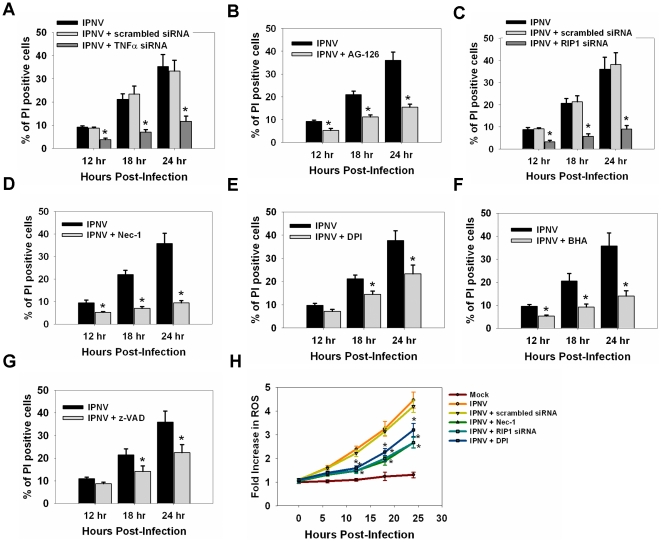
Figure 6. Inhibition of TNF-α or TNFR1 necrotic signaling complex formation inhibits secondary necrosis in IPNV-infected cells.
Detection of PI-positive cells following infection with IPNV. ZF4 cells were pre-treated with TNFα-specific siRNA (A), AG-126 (B), RIP1-specific siRNA (C), Nec-1 (D), DPI (E), BHA (F) and z-VAD (G) then infected with IPNV (MOI = 5), and incubated for 12, 18 and 24 h. (H) Detection of ROS production in RIP1-specific siRNA-, Nec-1- or DPI-pre-treated cells after IPNV infection at 0, 6, 12, 18 or 24 h p.i. Fluorescence assays were performed in triplicate. Data shown are the mean ± SD. Student's t tests indicate significant differences compared to IPNV infection only or untreated control: *, p<0.05.

