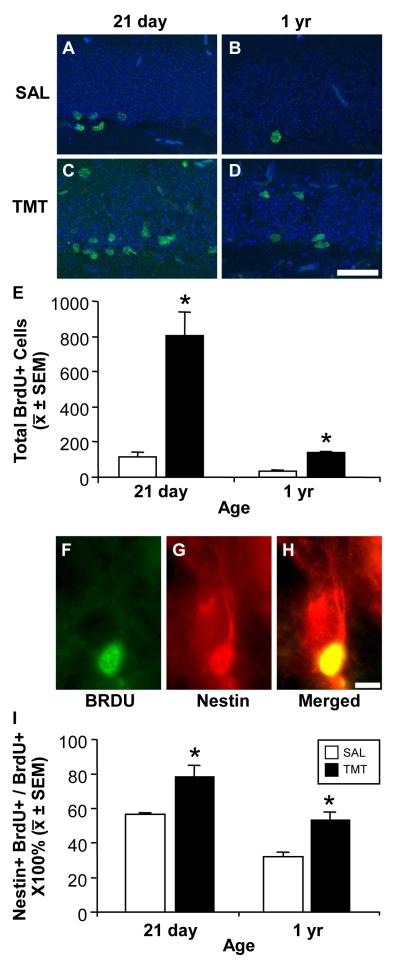
Figure 2.
(A-D) Representative immunofluorescent images of 5′-bromo-2′-deoxyuridine (BrdU) (green) and DAPI (blue) in the SGZ and GCL (A, B) along the inner cell layer of saline control mice and (C, D) within the GCL 48 h post- TMT (2.3 mg/kg i.p.). Scale bar = 50 μm. (E) Unbiased stereology of the number of BrdU+ determined by rare events protocol as described in Methods. Data represents mean ± SEM as defined in Methods and analyzed by a 2×2 ANOVA followed Bonferonni post hoc test (*p < 0.05). (F-H) Representative immunostaining of BrdU+ cells co-localized with nestin at 48 h post-TMT. Scale bar = 10 μm (I) Mean + SEM number of BrdU+ cells that co-stained with nestin within the SGZ and GCL. Data analyzed by a 2×2 ANOVA followed by Bonferonni post hoc test (*p < 0.05).

