Figure 3.
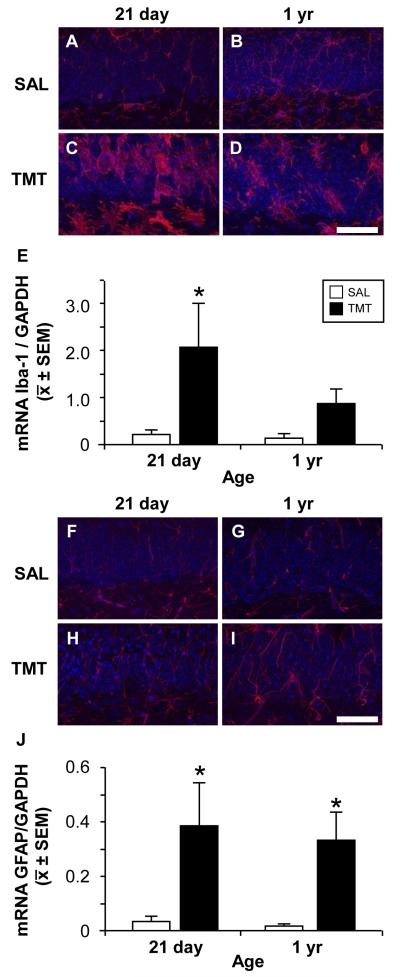
Representative images of Iba-1+ microglia (A-D, red) and GFAP+ astrocytes (F-I, red), DAPI (A-D, F-I, blue), in the GCL and SGZ (lower portion of each image) in saline control and 48 h post-TMT CD-1 male 21 day-old or 1 yr-old mice. (A) Iba-1+ cells in control 21 day-old mice showed thin elongated processes with distal ramifications. (B) Iba-1+ cells (red) in 1 yr-old mice showed increased staining thickened processes with proximal arborization. With TMT (C) Iba-1+ cells differentiated to a rounded amoeboid morphology in the GCL and cells with enlarged cell bodies and retracted processes in the hilus in the 21 day-old and (D) process bearing cells showing thickened and retracted processes in the 1 yr-old. (F-I) GFAP+ astrocytes (red) showing thin processes through the GCL in (F, G) control and an increased staining at 48 h post-TMT in both (H) 21 day-old and 1 yr-old (I). Scale bar = 50 μm. (E, J) qRT-PCR mRNA levels for Iba-1 and GFAP relative to GAPDH. (E) mRNA levels for Iba-1 were significantly elevated in the 21 day-old at 48 h post-TMT. (J) mRNA levels for GFAP were significantly elevated in the 21 day-old and 1 yr-old mice 48 h post-TMT. Data represents mean ± SEM. Data analyzed by a 2×2 ANOVA followed by Bonferonni post hoc test (*p<0.05).

