
Figure 4.
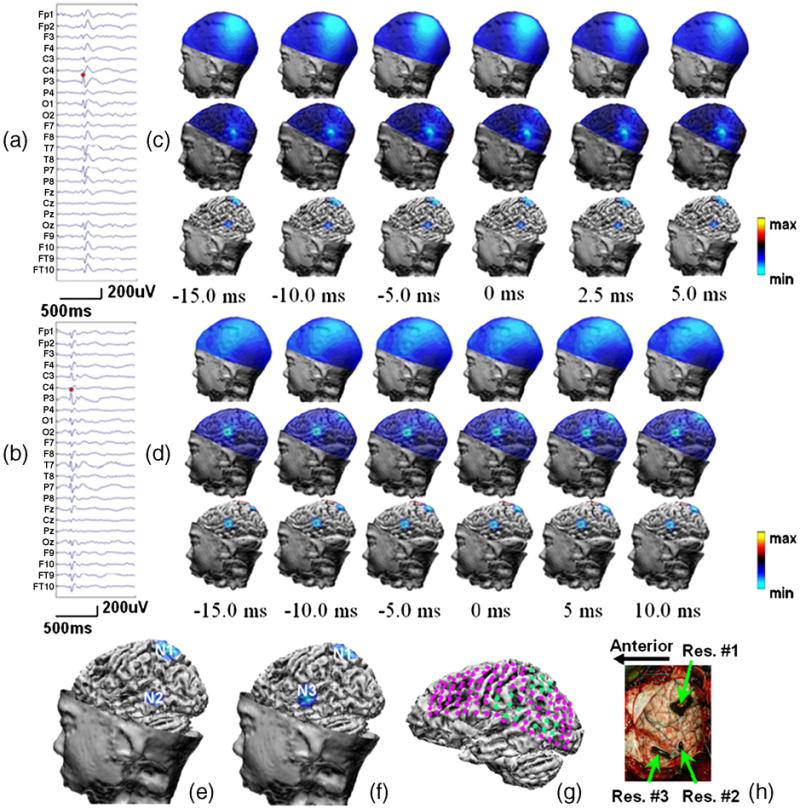
Patient #5. (a,b) Waveform of interictal spike #1 and #2; (c,d) Left-view scalp potential maps, estimated cortical potential distributions, and top 50% cortical activities superimposed onto the cortical surface at 6 time points of interictal spike #1 and #2; (e,f). The epileptogenic foci revealed by the CPI analysis of the peak activity of interictal spike #1 and #2 in left view; (g) Clinical diagnosis by neurologist, where pink dots are intracranial electrodes and green dots are SOZs; (h) Lateral view of the surgical resections.