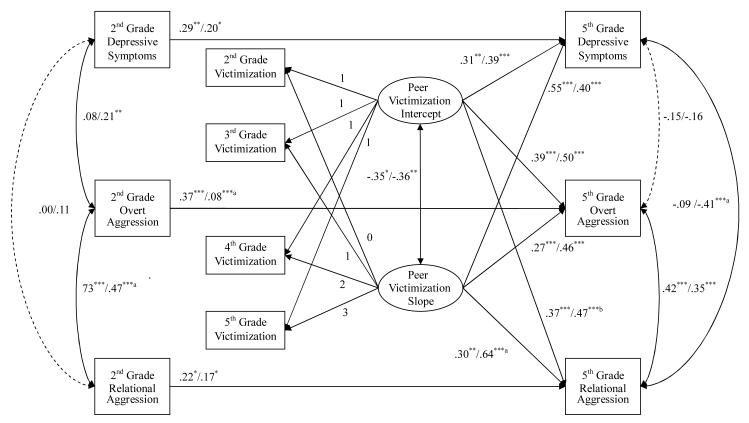
Figure 1.
Latent growth curve analysis of the contribution of initial victimization (2nd grade) and trajectories of victimization (2nd – 5th grade) to 5th grade depressive symptoms, overt aggression, and relational aggression, adjusting for 2nd grade adjustment. Coefficients for boys are on the left of the slash and coefficients for girls are on the right of the slash. Not shown are covariances between 2nd grade adjustment (i.e., depressive symptoms, overt aggression, and relational aggression) and the intercept and slope of the victimization trajectories (see text). Also not shown is a significant covariance between 3rd and 4th grade victimization. aSex difference at p < .05. bSex difference at p < .10.

